Devbox Windows OS Optimization#
TLDR: Setting your CPU affinity off of Core 0/1 sometimes gets you a big perf boost. Windows scheduler was not designed with high NUMA core counts in mind
You can use powershell scripts (start /affinity [mask] [executable]) or if you're like me, use ProcessLasso
Windows Scheduler Pains#
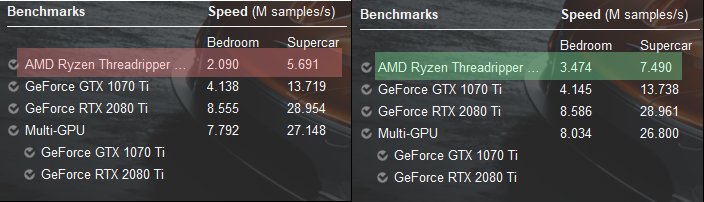
Was seeing some very terrible performance behavior on TR2 where it was worse than TR1 or other small core count CPUs. After investigating on the net, turns out there's lots of contention on Core 0/1 with Windows
Also bizarre that even in cases where an app/benchmark was using all cores, there was still a noticeable perf improvement. Not sure about internals of windows scheduler but even in NUMA aware mode, there seems to be a benefit in explicitly pinning PIDS
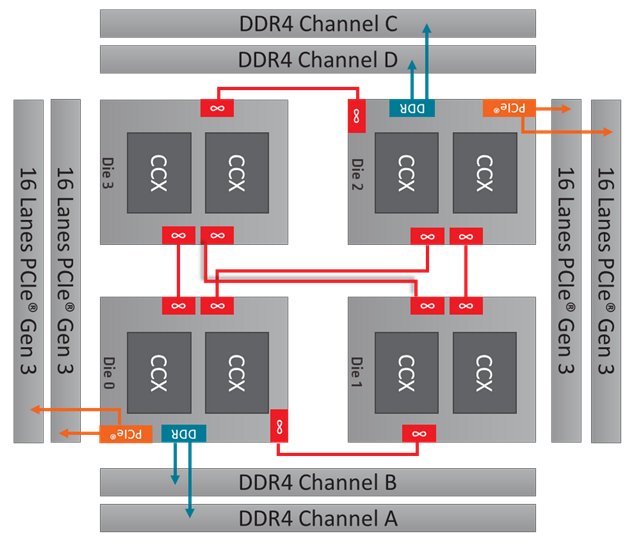
AMD added Dynamic Local Mode to auto pin threads to the die with fastest local memory access based on CPU usage.
Here's the memory layout of TR2 and more details from AMD on Dynamic Local Mode
conjecture Possible causes for schedule wars: context switches sys calls post-spectre world are expensive (iirc, intel hard flushes l1 cache). Possible that context switching on pinned PIDs does not due this but this is more for @markrussinovich or @BruceDawson0xB domain
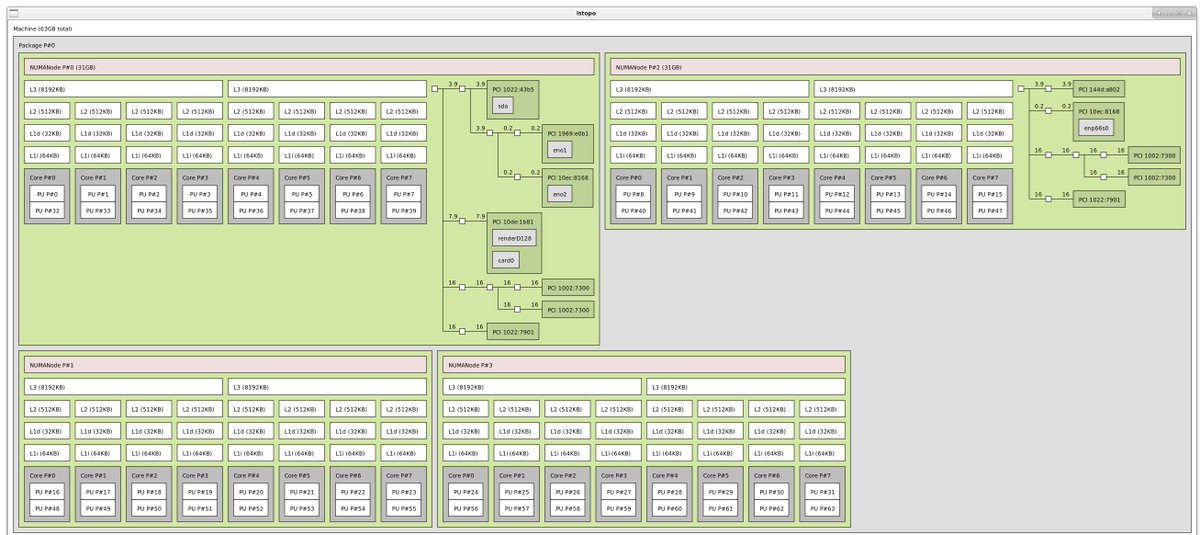
Also interesting seeing the PCIe channel access to the numa nodes. Here's an lstopo diagram (which runs on windows too!)
For more detailed deep dives:
Finally, at least on my mobo, changing DRAM memory interleaving and interleaving size didn't make a perf impact but caveat I didn't extensively test
Latency#
-
Windows Settings
-
⭐ Graphics → Hardware GPU Scheduling: On
- ⚠ Graphics → Variable Refresh Rate: On
- ⚠ Gaming → GameMode: On
-
Nvidia Control Panel
-
⭐ Manage 3D Settings → Power management mode: Prefer maximum Performance
- ⚠ Manage 3D Settings → Low Latency mode: Ultra
- ⚠ Setup G-SYNC → Enable G-Sync: Fullscreen
-
Resources
-
https://www.nvidia.com/en-us/geforce/guides/gfecnt/202010/system-latency-optimization-guide
- https://devblogs.microsoft.com/directx/os-variable-refresh-rate/
- https://devblogs.microsoft.com/directx/hardware-accelerated-gpu-scheduling/
- https://blurbusters.com