Configuring Windows Debugging Settings#
Postmortem Debugging#
-
Configure System Crash Dump Options
-
UI:
Windows Settings->About->Advanced Tab->Startup and Recovery Settings - Registry Key:
HKEY_LOCAL_MACHINE\SYSTEM\CurrentControlSet\Control\CrashControl -
Configuring postmortem debugger:
HKEY_LOCAL_MACHINE\SOFTWARE\Microsoft\Windows NT\CurrentVersion\AeDebug -
Debugger=REG_SZ:[DebuggerCmd]value: specify postmortem debugger where[DebuggerCmd]is invocation command- 1st
%ld: replaced with theProcess ID - 2nd
%ld: replaced with theEvent Handle - Ex:
"C:\debuggers\windbg.exe" -p %ld -e %ld -g
- 1st
Auto=REG_SZ:[0|1]value: configure automatic debugging behavior0: disable auto invoke and show user interaction dialog1: enable auto invoke and hide user interaction dialog
.\AutoExclusionList\[ExeName]=dword:00000001value: exclude[ExeName]from automatic debugging e.g."DWM.exe"=dword:00000001
-
AeDebugdefault registry entries
Text OnlyHKEY_LOCAL_MACHINE SOFTWARE Microsoft Windows NT CurrentVersion AeDebug Auto = 1 AutoExclusionList DWM.exe = 1
Windows Debugging Tips#
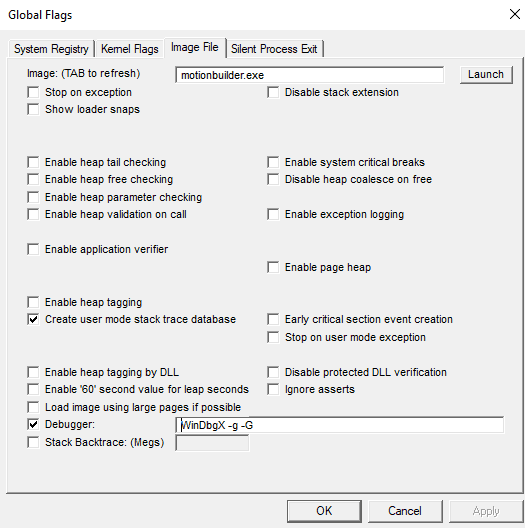
GFlags#
Global Flags Editor (WindowsSDK\Debuggers\x64\gflags.exe) enables/disables advanced windows diagnostic settings/registry keys
-
features
-
advanced debugging settings e.g. break on process launch
- page heap allocation monitoring/verification
- kernel object reference tracing
-
[!warning]
gflags.exemust be run as admin to set windows debug settings
SysInternals#
Collection of useful system troubleshooting tools
WinObjshows all the OS objectsSigCheck -a sftvolwin7.sys: verify valid signature and shows file version infoTCPView: see all network trafficProcmon: count occurrences; result will collate all errors