Visual Studio Tips & Tricks#
Useful Flags#
/d1PP: print preprocessor macros/d1reportAllClassLayout & /d1reportSingleClassLayoutXXX: dump class packing and alignment layout
VS Debugger#
Context Operator Syntax#
- There are two ways of specifying context (Reference)
1.{,,[module] } expression- The braces must contain two commas and the module (executable or DLL) name or full path.
- For example, to set a breakpoint at the SomeFunction function of EXAMPLE.dll:
{,,EXAMPLE.dll}SomeFunctionmodule!expression
1.module!expression- Ex:
EXAMPLE.dll!SomeFunction
- module is the name of a module. You can use a full path to disambiguate between modules with the same name.
- If the module path includes a comma, an embedded space, or a brace, you must use quotation marks around the path so that the context parser can properly recognize the string. Single quotation marks are considered part of a Windows file name, so you must use double quotation marks. For example,
{,,"a long, long, library name.dll"} g_Var- expression is any valid C++ expression that resolves to a valid target, such as a function name, variable name, or pointer address in module.
- When the expression evaluator encounters a symbol in an expression, it searches for the symbol in the following order:
- Lexical scope outward, starting with the current block, series of statements enclosed in braces, and continuing outward with the enclosing block. The current block is the code containing the current location, instruction pointer address.
- Function scope. The current function.
- Class scope, if the current location is inside a C++ member function. Class scope includes all base classes. The expression evaluator uses the normal dominance rules.
- Global symbols in the current module.
- Public symbols in the current program.
Commands & PseudoVars#
alias: List useful commands- Command window:
? …to execute immediate window things - Immediate window:
> …to execute commands e.g.>shell cmd
| Pseudovariable | Function (Reference) |
|---|---|
| $err | Displays the last error value set with the function SetLastError. The value that is displayed represents what would be returned by the GetLastError function. Use $err,hr to see the decoded form of this value. For example, if the last error was 3, the $err,hr would display ERROR_PATH_NOT_FOUND : The system cannot find the path specified. |
| $handles | Displays the number of handles allocated in your application. |
| $vframe | Displays the address of the current stack frame. |
| $tid | Displays the thread ID for the current thread. |
| $env | Displays the environment block in the string viewer. |
| $cmdline | Displays the command line string that launched the program. |
| $pid | Displays the process id. |
| $registername/@registername | Displays the contents of the register registername. Normally, you can display register contents just by entering the register name. The only time you need to use this syntax is when the register name overloads a variable name. If the register name is the same as a variable name in the current scope, the debugger interprets the name as a variable name. That's when $registername or @registername comes in handy. |
| $clk | Displays the time in clock cycles. |
| $user | Displays a structure with account information for the account running the application. For security reasons, the password information is not displayed. |
| $exceptionstack | Displays the stack trace of the current Windows Runtime exception. $ exceptionstack works only in UWP apps. $ exceptionstack is not supported for C++ and SEH exceptions |
| $returnvalue | Displays the return value of a .NET Framework method. |
Format Specifiers#
| Specifier | Format | Original Watch Value | Value Displayed |
|---|---|---|---|
d |
decimal integer | 0x00000066 |
102 |
o |
unsigned octal integer | 0x00000066 |
000000000146 |
x,h |
hexadecimal integer (with leading 0x) | 102 |
0xcccccccc |
X,H |
hexadecimal integer (with leading 0x) | 102 |
0xCCCCCCCC |
xb,hb |
hexadecimal integer (no leading 0x) | 102 |
cccccccc |
Xb,Hb |
hexadecimal integer (no leading 0x) | 102 |
CCCCCCCC |
b |
unsigned binary integer (with leading 0b) | 25 |
0b00000000000000000000000000011001 |
bb |
unsigned binary integer (no leading 0b) | 25 |
00000000000000000000000000011001 |
e |
scientific notation | 25000000 |
2.500000e+07 |
g |
shorter of scientific or floating point | 25000000 |
2.5e+07 |
c |
single character | 0x0065 |
101 'e' |
s |
const char* string (with quotes) |
<location> "hello world" |
"hello world" |
sb |
const char* string (no quotes) |
<location> "hello world" |
hello world |
s8 |
UTF-8 string (with quotes) | <location> "This is a UTF-8 coffee cup â˜-" |
"This is a UTF-8 coffee cup ☕" |
s8b |
UTF-8 string (no quotes) | <location> "hello world" |
hello world |
su |
Unicode (UTF-16 encoding) string (with quotes) | <location> L"hello world" |
L"hello world",u"hello world" |
sub |
Unicode (UTF-16 encoding) string (no quotes) | <location> L"hello world" |
hello world |
bstr |
BSTR binary string (with quotes) | <location> L"hello world" |
L"hello world" |
env |
Environment block (double-null terminated string) | <location> L"=::=::\\" |
L"=::=::\\\0=C:=C:\\windows\\system32\0ALLUSERSPROFILE=... |
s32 |
UTF-32 string (with quotes) | <location> U"hello world" |
U"hello world" |
s32b |
UTF-32 string (no quotes) | <location> U"hello world" |
hello world |
en |
enum | Saturday(6) |
Saturday |
hv |
Pointer type indicating value is array heap allocation address e.g. new int[3]. |
<location>{<first member>} |
<location>{<first member>, <second member>, ...} |
na |
Suppresses the memory address of a pointer to an object. | <location>, {member=value...} |
{member=value...} |
nd |
Displays only the base class information, ignoring derived classes | (Shape*) square including base+derived class information |
Displays only base class information |
hr |
Win32/HRESULT error code; unnecessary for HRESULTs bc debugger auto decodes them | S_OK |
S_OK |
wc |
Window class flag | 0x0010 |
WC_DEFAULTCHAR |
wm |
Windows message numbers | 16 |
WM_CLOSE |
nr |
Suppress "Raw View" item | ||
nvo |
Show "Raw View" item for numeric values only | ||
! |
Raw format, ignoring any data type views customizations | <customized representation> |
4 |
handle |
Displays information about win32 handle | 0x000000000000009c |
Displays useful information about handle such as thread ID, etc. |
Format Pointers as Arrays#
| Specifier | Format | Original Watch Value | Value Displayed |
|---|---|---|---|
| n | Decimal or hexadecimal integer | pBuffer,[32] pBuffer,[0x20] | Displays pBuffer as a 32 element array. |
| [exp] | A valid C++ expression that evaluates to an integer. | pBuffer,[bufferSize] | Displays pBuffer as an array of bufferSize elements. |
| [exp]s | Format array with specifier e.g. string | pBuffer,[bufferSize]s | Displays pBuffer as a sized string array |
| expand(n) | A valid C++ expression that evaluates to an integer | pBuffer, expand(2) | Displays the third element of pBuffer |
Magic Numbers#
| Code | Description (Reference) |
|---|---|
0xCCCCCCCC |
Used by Microsoft's C++ debugging runtime library and many DOS environments to mark uninitialized stack memory. CC resembles the opcode of the INT 3 debug breakpoint interrupt on x86 processors. |
0xCDCDCDCD |
Used by Microsoft's C/C++ debug malloc() function to mark uninitialized heap memory, usually returned from HeapAlloc()[15] |
0xFDFDFDFD |
Used by Microsoft's C/C++ debug malloc() function to mark "no man's land" guard bytes before and after allocated heap memory[15] |
0xFEEEFEEE |
"Fee fee", Used by Microsoft's debug HeapFree() to mark freed heap memory. Some nearby internal bookkeeping values may have the high word set to FEEE as well.[15] |
CRT runtime Debugging Techniques#
http://msdn.microsoft.com/en-us/library/zh712wwf(v=vs.120).aspx
http://msdn.microsoft.com/en-us/library/k70yt3e2.aspx
Global in Watch Window#
The way to scope the global is as follows using the Context Operator:
{,,foobar.dll}g_pMyStruct
where foobar.dll defines g_pMyStruct as a global pointer. The same syntax can be used to scope breakpoints as well.
Advanced Debugging#
- Common Visual Studio Commands
- https://docs.microsoft.com/en-us/visualstudio/ide/reference/visual-studio-commands
- Complete commands can be found in Keyboard, EnvironmentOptions dialog box
- Can use VCMD to create macros as commands
- In the immediate window, prefix a command with > to execute e.g.
>Debug.AttachDetach -
Execute code in a macro (Reference)
C#DTE.Debugger.ExecuteStatement("variable_name=0") -
Can execute code in Action:print message section of breakpoint settings by wrapping the value in textfield with {}. Ex:
{variable_name=0}will set variable_name=0- You can also concatenate several instructions on the same line. They simply have to be separated by curly braces (Reference)
C++{ {done = (i == 100);} { object.x -= 1.0f; } { data[15] = 3; } }
Tools#
- WinDBG
- Perfmon
- Process Explorer
- Windows Performance Toolkit
Rules of thumb#
- If CPU kernel utilization is high, then it's a driver problem
- If System interrupts .1%, driver problem
- In process monitor, look at System|interrupts process and look at threads/modules to see what's pegging CPU
- Driverquery |find "driverdllname" to find info about a driver (don't use
- strings binary.exe: >bla.txt sysinternals tool to produce all string parameters for a binary
Misc#
Debugging Dependencies#
Property Sheets#
- Dump final merged properties from all .props files:
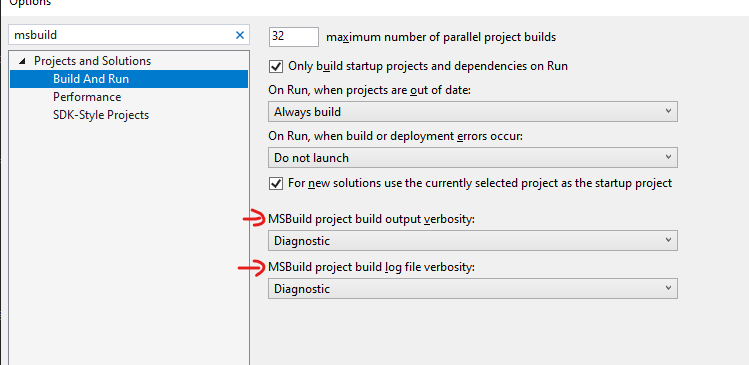
msbuild /pp:temp.xml .build/es2.vcxproj - You can also set the MSBuild Logging level to Diagnostic