Tolva perf tool helpers
Perf Tool
-
Editor Toolbar Button to launch current map for perf testing.
-
Command line is:
C++{full_path_to_ue4editor.exe} {fullpathto_BBR.uproject {current_map}?Listen -game -Multiprocess -messaging -SessionName="PerfTesting Mode" -MultiprocessSaveConfig -MultiprocessOSS WinX=5 WinY=495 SAVEWINPOS=1 -NoVerifyGC -NoAILogging -
Make sure to on launch:
-
For the existing instance:
-
Warn if EditorPerformance.UseLessCPUWhenInBackground == False
-
Set Editor Real Time Viewport = False
-
Reference (but probably already exposed in python)
EditorViewportClient.SetRealtime( false, false )
const FLevelEditorViewportClient& ViewClient = Viewport.Pin()->GetLevelViewportClient
ViewClient.IsRealtime()
-
-
Try to minimize the editor window.
TSharedPtr<SWindow> RootWindow = FGlobalTabmanager::Get()->GetRootWindow();

if (RootWindow.IsValid() && bShouldMinimizeRootWindow)
{
  RootWindow->Minimize();
}
-
For the launched instance(Likely need a command line arg to set a "profiling mode" or parse the -SessionName on-map-load and verify this state):
-
Make sure vsync, frame smoothing, and t.maxfps is off
-
Make sure r.ForceDebugViewModes=1
-
Make sure t.IdleWhenNotForeground=1
-
Normal Mode options:
-
-ResX=2160 -ResY=1200 -nohmd -windowed -ExecCmds="r.screenpercentage 140,r.pd=1"
-
VR Emulation variant options:
-
-ResX=2160 -ResY=1200 -nohmd -windowed -emulatestereo -ExecCmds="r.screenpercentage 140,r.pd=1"
-
VR Mode:
-
vr
-
Optional useful Params:
-
Deterministic (shortcut for -fixedtimestep/-fixedseed)
-
fixedtimestep
-
FixedSeed
-
usefixedtimestep
-
debug (To Launch In DebugGame)
-
log or -log LOG=logfile.txt
-
FORCELOGFLUSH
-
nologging
-
NoTextureStreaming
-
nosound
D3D Debugging
-
D3DDEBUG
-
d3dbreakonwarning
-
ONETHREAD
-
VSPerf
-
VTune
For Paths, look at FPaths struct (e.g. FPaths::GetProjectFilePath())
-
Command to build + cook + launch game
-
Click the command => SWindow Popout with checkboxes+comboboxes to {build|cook} {engine|standalone} {development|debuggame} BBR
-
Persist to config (kiteandlightning.py has example of ConfigParser)
-
Create new ABBDebugController from ADebugCameraController. This can be our base class for debugging
-
Add capture debug frustum console command to this class. Easiest way is make a
UFUNCTION(exec)
void CaptureDebugFrustum();There's a UDrawFrustumComponent* DrawFrustum that is already in ADebugCameraController. You just need to update its values
Also look at Ethan Carter Extension to freeze rendering. Note: this might be not applicable anymore and also single eye frustum culling has been implemented in the engine already
I had added drawing a debug frustum to the FREEZERENDERING command to aid in debugging culling using a joint frustum for both eyes. I had improved the DrawDebugFrustum() code to better handle the inverse-Z projection matrices that UE4 uses, and also to allow a plane set to be the data source.
Reference From https://medium.com/@TheIneQuation/the-vanishing-of-milliseconds-dfe7572d9856
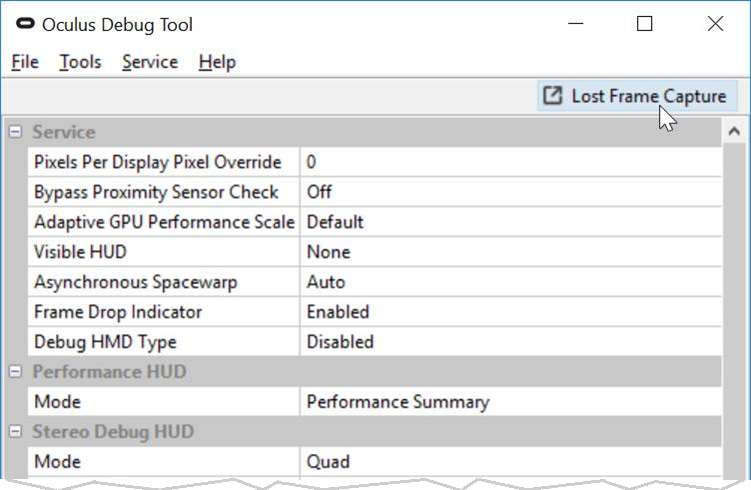
Command To Launch Oculus Perf tool:
-
Should toggle the oculus perf hud (this is exposed through console command): Should have these modes
-
The 4 different modes for Oculus PerfHud
-
The minimal perf hud mode that shows L,C,F depending on what missed frame rate (https://developer.oculus.com/documentation/pcsdk/latest/concepts/dg-performance-warning)
-
Also force disable timewarp when launching
-
See if you can bypass proximity sensor check. The Oculus Lost Frame Capture tool has a setting which probably means it writes to a registry key. You can snoop it using ProcMon:
https://developer.oculus.com/documentation/pcsdk/latest/concepts/dg-performance-lostframes
-
Pause Game Thread: (pause)
-
Pause Game Thread Clock update (e.g. slomo = 0)
-
Game Thread should keep ticking but game engine should not increase the game clock so we can deterministically analyze current frame tick
Low-Pri
- Low-pri: Add Ethan Carter's implementation of STAT RELEVANTLIGHTS:
https://github.com/inequation/UnrealEngine/commit/c986362a92c56b498982b200b0f36a09723202a4
-
Command to capture ETW tracefile using ovrlog or ovrlog_win10.
-
Oculus Guide on ETW/GPUView: https://developer.oculus.com/documentation/pcsdk/latest/concepts/dg-performance-tutorial
-
This chapter from this book is another detailed good resource (I have the ebook, ask me when you get to it):
-
Chapter 2. Understanding, Measuring, and Analyzing VR Graphics Performance (by James Hughes, Reza Nourai, and Ed Hutchins) in the book GPU Zen: Advanced Rendering Techniques (Wolfgang Engel, ed)
-
Grab Individual stat numbers and construct our own groups:
For reference, Look at
-
DumpFrame(int64 Frame)
-
DumpHistoryFrame(Stats, Latest, DumpCull, MaxDepth, *NameFilter);
-
DumpCPUSummary()
-
DrawStatsHUD() is where the stats drawing happens
-
[Accessing Single Stat Values]
-
Command to programmatically capture a frame:
-
Use dxcap: https://msdn.microsoft.com/en-us/library/hh780905.aspx
dxcap -c UnrealEngine\Engine\Binaries\Win64\UE4Editor-Win64-Debug.exe BBR\BBR.uproject 0-Lobby -log -debug -d3ddebug -game
dxcap -frame 8s -c UnrealEngine\Engine\Binaries\Win64\UE4Editor-Win64-Debug.exe BBR\BBR.uproject 0-Lobby -log -game
-
Programmatic NSight capture would be great too:
-
Launch Project with NSight HUD:
- "C:\Program Files (x86)\NVIDIA Corporation\Nsight Visual Studio Edition 5.3\Monitor\Common\Nvda.Launcher.exe" "%1"
- Ex:
- "C:\Program Files (x86)\NVIDIA Corporation\Nsight Visual Studio Edition 5.3\Monitor\Common\Nvda.Launcher.exe" "C:\UE4Editor.exe" BBR.uproject -log
Launch NSight Monitor
-
Make sure to launch nsmonitor with admin priv
-
Adjust WDDM TDR for Nsight
-
Enable Driver Instrumentation
-
Make sure to warn if these settings arent set:
-
t.maxfps=0
-
Set BBIsGPUProfiling = true
-
Remember to pass -d3ddebug
-
Exhaustive D3D11 shader collection
-
Make sure to set shader include paths
-
Make sure to set application is a launcher
-
Set Force Assembly debugging if you cant find source = true
-
Set Preferred remote shader debugging mode = Replay-based debugging
-
Tick One Frame Forward at Fixed Interval
-
Command to Toggle Determinism (e.g. Fixed Random Seed, Set Fixed Timestep, etc). Look at what these commandline options are and see if it's possible to set them at runtime
-
Deterministic (shortcut for -fixedtimestep/-fixedseed)
-
fixedtimestep
-
FixedSeed
-
usefixedtimestep
-
Custom Stats Visualizer Widget: Should display window with visualizer for render budget
-
Make a better variant of "Budget BebylonPerf"
-
Diagram for Stats System: [Stats System Diagram]
-
Expose a way to Python to extract specific stats
-
Slate widget for graphs/charts: https://www.unrealengine.com/marketplace/datatracker-plugin or https://www.unrealengine.com/marketplace/kantan-charts
-
Launcher Mode for Shader Debugging:
Commands for toggling debug & perf markers:#
ToggleDrawEvents: Emits helpful draw event markers for use with GPU Capture/PIX
r.ShowMaterialDrawEvents: Shows material around each drawcall in profilegpu
r.EmitMeshDrawEvents
r.RHISetGPUCaptureOptions
r.ProfileGPUSort 2, ProfileGPU
r.ProfileGPU.Pattern
r.ProfileGPU.ShowLeafEvents
r.ProfileGPU.ShowTransitions
r.ProfileGPU.PrintAssetSummary
r.ProfileGPU.AssetSummaryCallOuts
r.ProfileGPU.Sort
r.RHICmdUseThread=0
r.RHICmdBypass=1
r.RHICmdUseParallelAlgorithms=1
ToggleRHIThread
r.ParallelTranslucency
Commands for debug logging#
r.D3DDumpAMDCodeXLFile

r.D3DDumpD3DAsm
General#
; Uncomment to get detailed logs on shader compiles and the opportunity to retry on errors
r.ShaderDevelopmentMode=1
r.CompileShadersForDevelopment=1
r.MaterialEditor.UseDevShaders=1

[DevOptions.Shaders]
; See FShaderCompilingManager for documentation on what these do
bAllowCompilingThroughWorkers=True
bAllowAsynchronousShaderCompiling=True
; Make sure we don't starve loading threads
NumUnusedShaderCompilingThreads=3
; Make sure the game has enough cores available to maintain reasonable performance
NumUnusedShaderCompilingThreadsDuringGame=4
; Batching multiple jobs to reduce file overhead, but not so many that latency of blocking compiles is hurt
MaxShaderJobBatchSize=10
bPromptToRetryFailedShaderCompiles=True
bLogJobCompletionTimes=False
; Only using 10ms of game thread time per frame to process async shader maps
ProcessGameThreadTargetTime=.01
;For XboxOne PIX support
ShaderPDBRoot=D:\DirectoryOfChoice
Sanity Checking Commands#
r.ShowShaderCompilerWarnings=1
r.D3DCheckShadersForDouble=1
Debug Logging#
; Uncomment to dump shaders in the Saved folder
; Warning: leaving this on for a while will fill your hard drive with many small files and folders
r.DumpShaderDebugInfo=1
; When this is enabled, dumped shader paths will get collapsed (in the cases where paths are longer than the OS's max)
r.DumpShaderDebugShortNames=1
; When this is enabled, when dumping shaders an additional file to use with ShaderCompilerWorker -direct mode will be generated
r.DumpShaderDebugWorkerCommandLine=1
Add these when running with a graphical debugger like NSight (but not when profiling)#
r.Shaders.Optimize=0
r.Shaders.KeepDebugInfo=1
r.ShowShaderCompilerWarnings=1
r.XGEShaderCompile=0
r.D3D.RemoveUnusedInterpolators=0
r.GraphicsAdapter=0
r.D3D12GraphicsAdapter=0
ToggleDrawEvents: Emits helpful draw event markers for use with GPU Capture/PIX
r.ShowMaterialDrawEvents: Shows material around each drawcall in profilegpu
r.EmitMeshDrawEvents=1
r.RHISetGPUCaptureOptions=1
r.RHICmdUseThread=0
r.RHICmdBypass=1
bb.IsGPUProfiling=1
  - Prevents render heartbeat thread from reporting a deadlock if we're in a debugger and paused
bb.perf.SetShaderCompileMode=0
  - This is equivalent to at runtime doing:
    [DevOptions.Shaders]
    ; See FShaderCompilingManager for documentation on what these do
    bAllowCompilingThroughWorkers=False
    bAllowAsynchronousShaderCompiling=False